简介
toyplot是一个基于canvas的简洁的Python可视化库,还在发展中,目前是0.19版;
打印标准图,有一定交互性,底层是canvas,易于在前端使用分享;
在notebook中的渲染,在其他环境中的内嵌做得挺好;qt等GUI环境支持好;
用css的写法配置样式,目前这个库在gtihub上有400余个star。
绘图框架:
1 | import toyplot |
画布+坐标系统+映射类型
With Toyplot, a figure always consists of three parts:
- A canvas
- One or more sets of coordinate systems added to the canvas.
- One or more marks added to the axes.
详解:
建
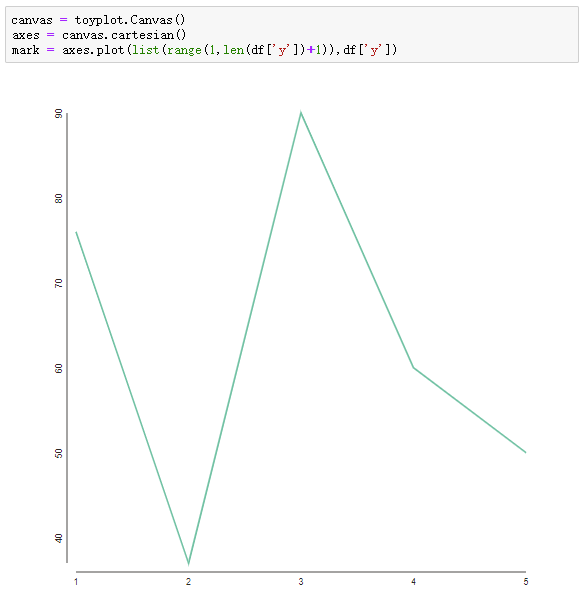
cartesian 笛卡尔坐标系
只传y的数,x会默认使用range(0,len(y))
以上语句也可以用连缀写法写为:
···toyplot.Canvas().cartesian().plot(y)
axes.plot(x, series) 传x,传y,设置样式;
图形默认更好地展示,y轴不默认从0开始
css样式写法,在plot对象里用
多条线就在axes多调用

多条曲线也可以写 mark = axes.plot(x, series) #series = numpy.column_stack((y1, y2, y3))
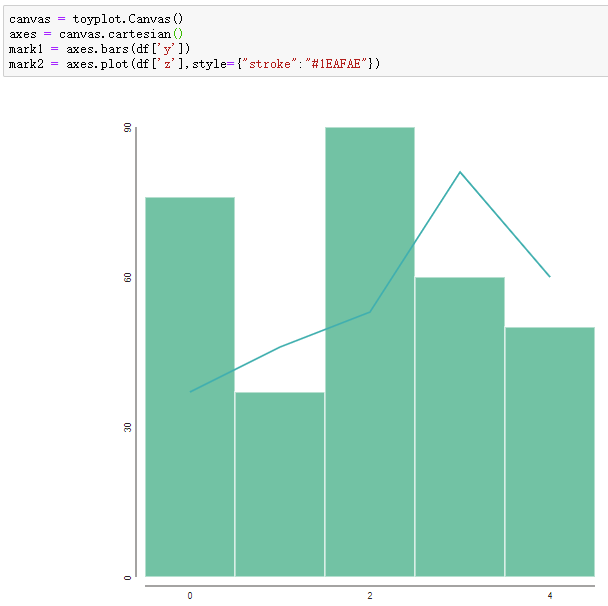
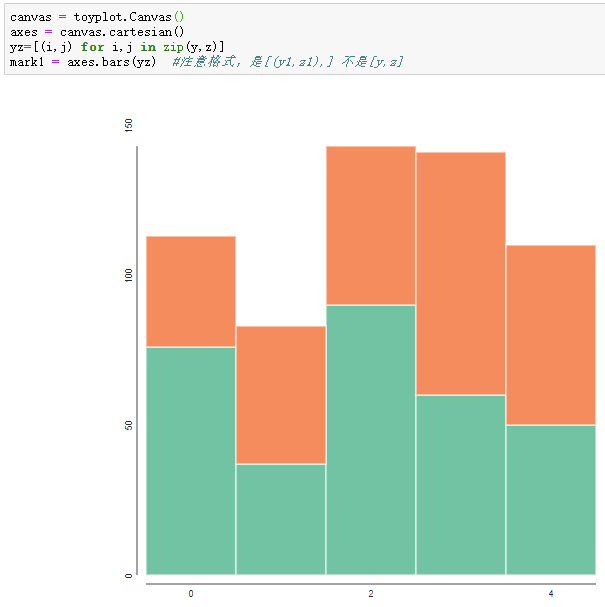
bars 不是bar
1 | canvas = toyplot.Canvas() |
【bar+line】 (图层顺序,语句顺序对应图层顺序,举例,在前在后)
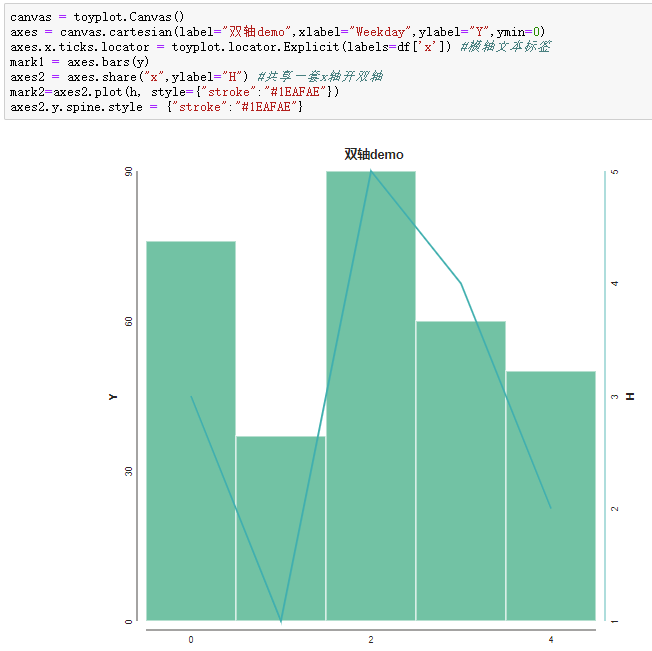
bar并且设置文本标签(会讲坐标映射,分类变量的处理)
(ValueError: could not convert string to float: ‘Mon.’)
设置文本角度 和上面的图对比一下
1 | canvas = toyplot.Canvas() |
设置标题及文本标签,双轴
1 | canvas = toyplot.Canvas() |
分面
1 | canvas = toyplot.Canvas(600, 300) |

grid
支持的图形目前挺有限,fill
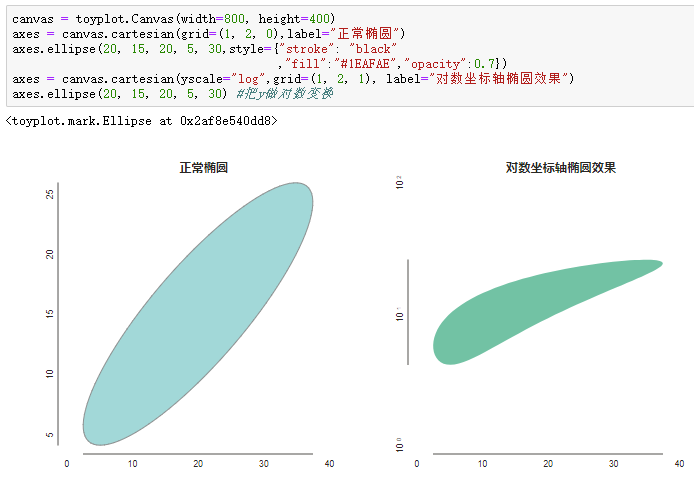
椭圆
作用:散点+椭圆边形成密度效果
toyplot.plot(y) 在matixe里说到
输入矩阵
两种写法;
但matrix就是属于toyplot的,目前写axes.matrix(mtx) 会报错说'Cartesian' object has no attribute 'matrix',所以mat只有一种写法,其他有两种;
交互及sav csv 方便数据交换
【矩阵图 动图,效果不是特别好,需要剪一下再说】
【目前mp4在d3的PPT里】
1 | #椭圆 |
1 | canvas = toyplot.Canvas(width=800, height=400) |
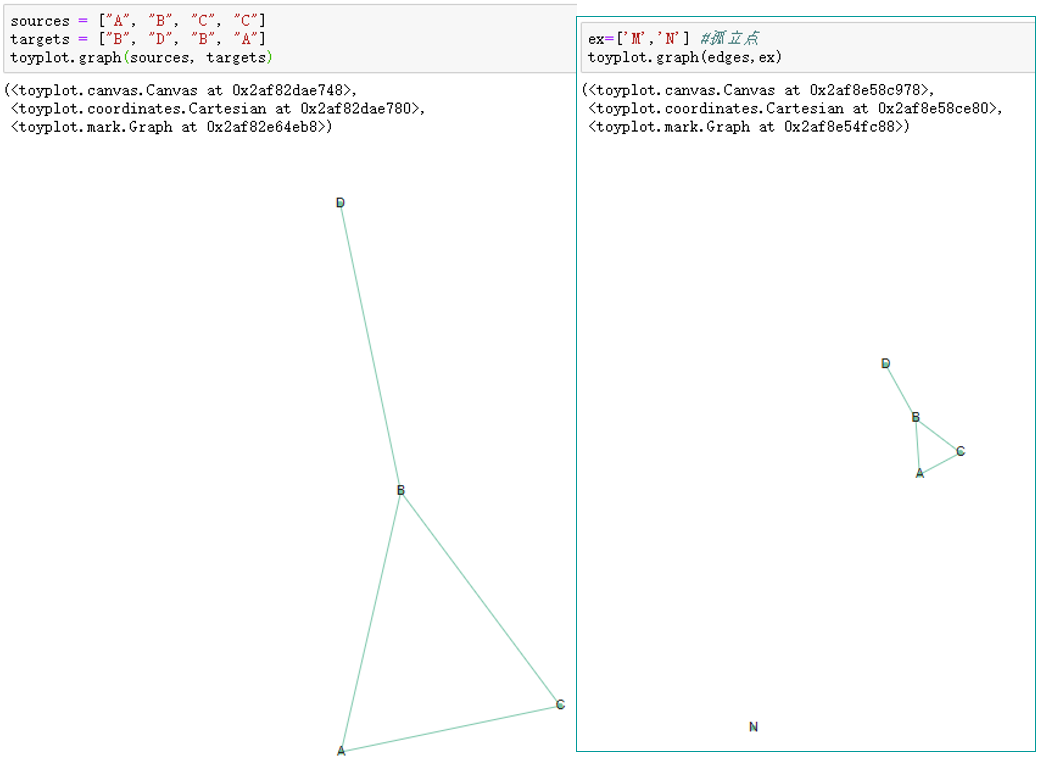
关系图
toyplot.graph(s,t)
1 | sources = ["A", "B", "C", "C"] |
1 | layout = toyplot.layout.FruchtermanReingold(edges=toyplot.layout.CurvedEdges()) |
设置节点的形状(如变成矩形)、颜色、边的样式(如虚线)、边的文本标签、指向 都能做到
节点颜色根据数值大小染色
目前没有pie
图片 toyplot.image(image, width=300) 结合PIL.Image
1 | import PIL.Image |
动画 canvas.frames 逐帧动画
1 | canvas = toyplot.Canvas(300, 300) |
输出
1 | import toyplot.pdf |
类似的有:
- toyplot.png.render(canvas, “figure1.png”)
- toyplot.html.render(canvas, “figure1.html”)
svg就复杂一些了,毕竟是需要canvas转svg存储。
1 | svg = toyplot.svg.render(canvas) |
总结
把简介再重复一下
toyplot是一个基于canvas的简洁的Python可视化库,还在发展中,目前是0.19版;
可能因为还不够完善,中文教程和介绍文章很少,几乎找不到详细的介绍文章;
参考资料