bqplot简介
官方文档简介是 一个jupyter notebook上的基于图形语法的声明式可视化框架
该库的目标是提供一套框架统一的二维可视化API,并且提供合理的交互接口。
和numpy的配合挺好的,pandas的一列也可以直接用
通过pip安装bqplot库之后,需要通过以下语句设置jupyter插件对bqplot,否则可能出不了图。
1 | jupyter nbextension enable --py --sys-prefix bqplot |
绘图框架
1 | from bqplot import Bars, Figure,LinearScale |

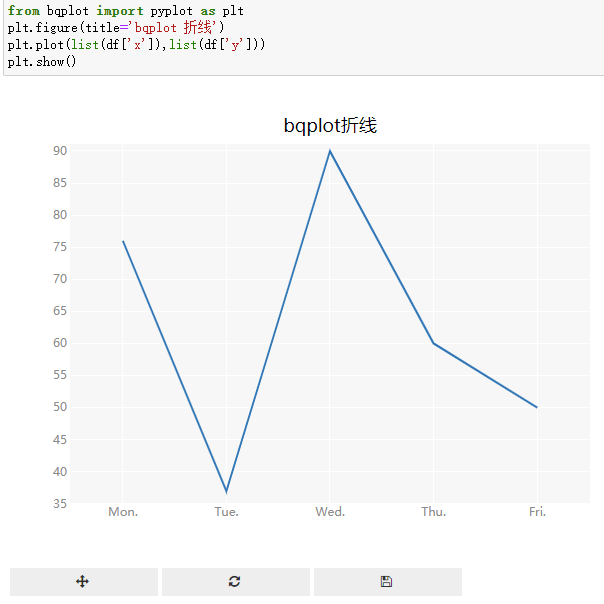
默认是折线;
有交互,可以放大缩小漫游,交互控件。
在语句组织方面,也可以先建立一个画布,往上加元素:
1 | from bqplot import pyplot as plt |
通过scc.y =df['z']可以更新y轴的数据,刷新显示的图。
scatter_plot.marker = ‘diamond’
Pyplot 的语法
the Grammar of Graphics paradigm 图形语法范式
有两套API接口,一套是上面用到的神似mat的写法,另一套属于pyplot的语法
The other one, the verbose API, is meant to expose every element of a plot individually,
冗长的语法,可以逐个操作图形中的每个元素;to build complex and feature-rich GUIs
o understand this verbose API, it helps to revisit what exactly the components of a plot are. 重新认识一张图的组成,首先是scale
A Scale is a mapping from (function that converts) data coordinates to figure coordinates.
比例尺,一个把数据从数据坐标系转换到图形元素坐标系 的映射
Scale takes a set of values in any arbitrary unit (say number of people, or $, or litres) and converts it to pixels (or colors for a ColorScale).
例如:一串数值到像素多少,颜色值到颜色
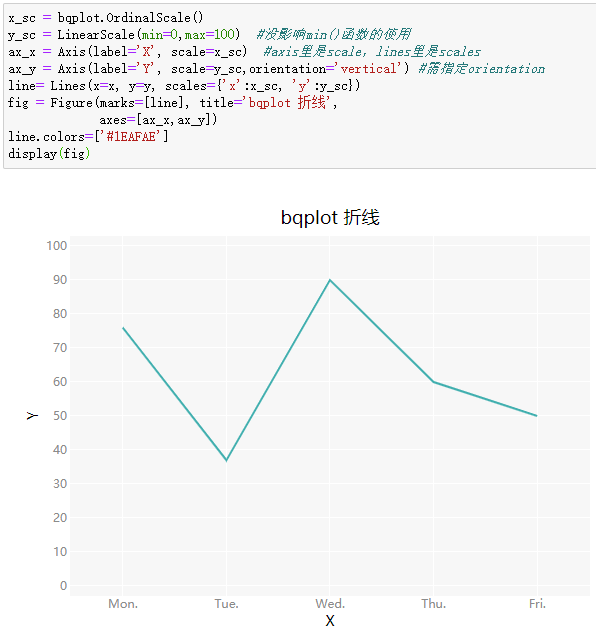
要完整画一条曲线(一些注释发文的时候删掉
1 | x_sc = bqplot.OrdinalScale() |

建立画布,要初始化比例尺、坐标轴,
需要指定orientation,否则都叠加在横轴
axes_options 设置xz y轴标签属性
axes_options = {‘x’: {‘label’: ‘Date’, ‘tick_format’: ‘%m/%d’},
‘y’: {‘label’: ‘Price’, ‘tick_format’: ‘0.0f’}}
fig = plt.figure(title=’Changing Styles’, background_style={‘fill’: ‘lightgreen’},
title_style={‘font-size’: ‘20px’,’fill’: ‘DarkOrange’})
plt.scatter(x, y)
绘制柱状图
其他是 from bqplot import Bars
注意是bars不是bar,从接口来看属于bqplot.marks.Bars
plt.bar()也可以;也是可以用bar.stroke = ‘red’ 设置样式?两套语法这个是通用的?
堆叠柱
每个柱颜色不同,能画条形图么?可以
orientation=’vertical’
条形图,标签是从下往上的;
color_mode 参数
Color mode has 2 values. ‘group’ and ‘element’.
‘group’ means for every x all bars have same color.
‘element’ means for every dimension of y, all bars have same color.
默认是auto,
基础图
标签是一个独立的图层
加文本标签,加一个bar_label图层
饼图-基础饼图-更新数据效果-排序效果-变成环状图效果
可以扔一个动图里
Object Model 是
pie = Pie(sizes=data
Figure(marks=[pie]
的写法
fig = plt.figure(animation_duration=1000)
pie = plt.pie(df[‘y’], display_labels=’outside’,labels=df[‘y’])
fig
是pyplot的写法;
The ‘labels’ trait of a Pie instance must be a list but a value of class ‘pandas.core.series.Series’
Element of the ‘labels’ trait of a Pie instance must be a unicode string, but a value of 76 <class ‘int’> was specified.
复合图
marks=[bar,line]
分面之类的呢?
文档里根本收不到facet
交互
scatter_chart.selected = [1, 2, 3]
使图形有选中的效果
增加事件监听:
1 | def foo(change): |
y变化时就会执行foo(change)
其他的监听事件:
#Adding call back to scatter events
print custom mssg on hover and background click of Blue Scatter
scatter_chart.on_hover(print_event)
scatter_chart.on_background_click(print_event)
#print custom mssg on click of an element or legend of Red Scatter
scatter_chart2.on_element_click(print_event)
scatter_chart2.on_legend_click(print_event)
bar_chart.interactions = {
‘legend_hover’: ‘highlight_axes’,
‘hover’: ‘tooltip’,
‘click’: ‘select’,
}
点击柱的时候会有选中高亮的效果
鼠标位置hover触发tooltip
支持地图:
可以放大缩小漫游
可以配置投影方式,
说明+代码+一个动图
1 | fig = plt.figure(title='Pyplot 分层设色世界地图') |
地图不需要额外的import
输出
fig.save_png()
总结
缺点:在jupyter环境中容易用,在其他ide里要调图不容易;
是图形对象,不是静态图片,关闭notebook后再打开就看不见绘图效果了,需要重新运行;
参考资料
官方文档 https://bqplot.readthedocs.io/en/latest/
github:https://github.com/bqplot/bqplot
和mat写法相似,比mat有语句更简洁的交互,数据更新时的渐变挺不错;